
Most steals per game last 30 days
Paul George leads the NBA with 5 steals per game in the last 30 days.
in the last 30 days
Paul George leads the NBA with 5 steals per game in the last 30 days.
| # | Player | Team | GP | STL per game | PTS | REB | AST |
|---|---|---|---|---|---|---|---|
| 1 | Paul George | BOS | 1 | 5.0 | 38 | 5 | 3 |
| 2 | 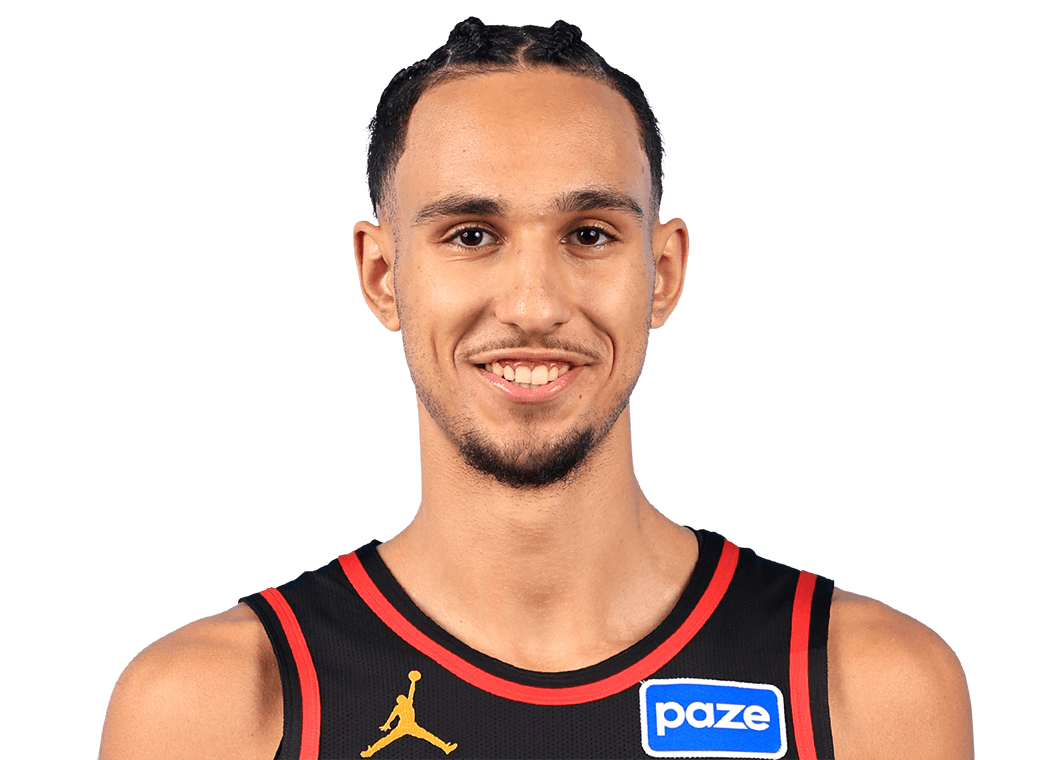 Zaccharie Risacher | DAL | 1 | 5.0 | 4 | 6 | 2 |
| 3 | 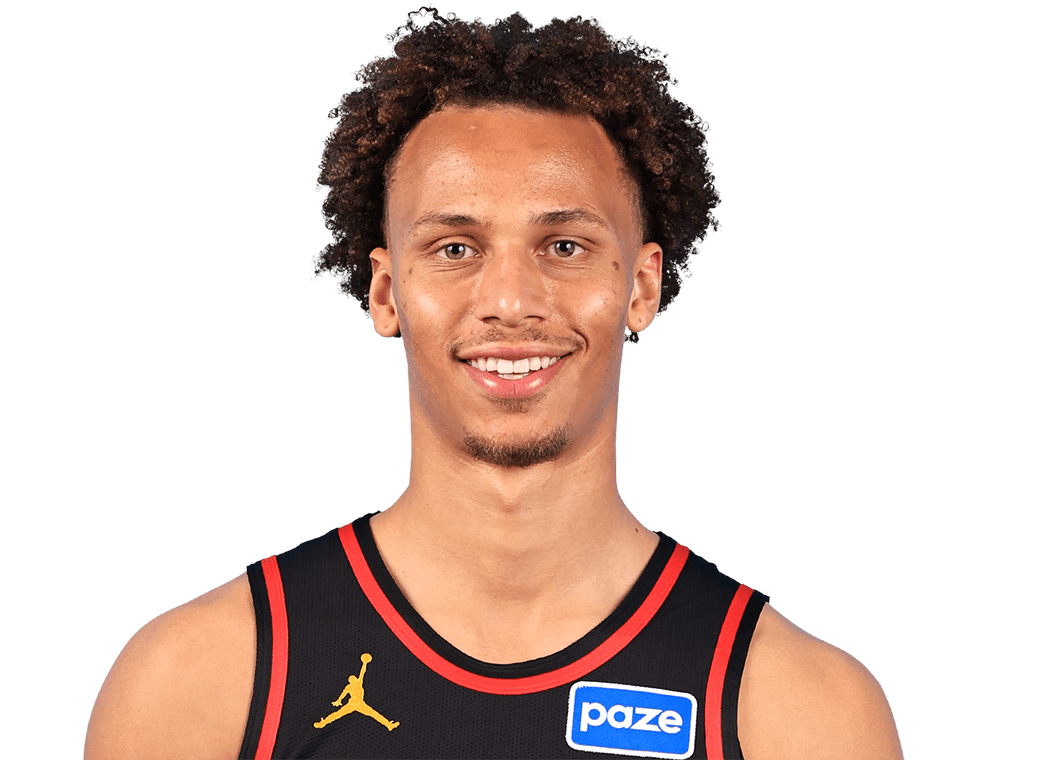 Dyson Daniels | ATL | 1 | 5.0 | 20 | 4 | 3 |
| 4 |  Moussa Diabate | CHA | 1 | 5.0 | 17 | 8 | 3 |
| 5 | 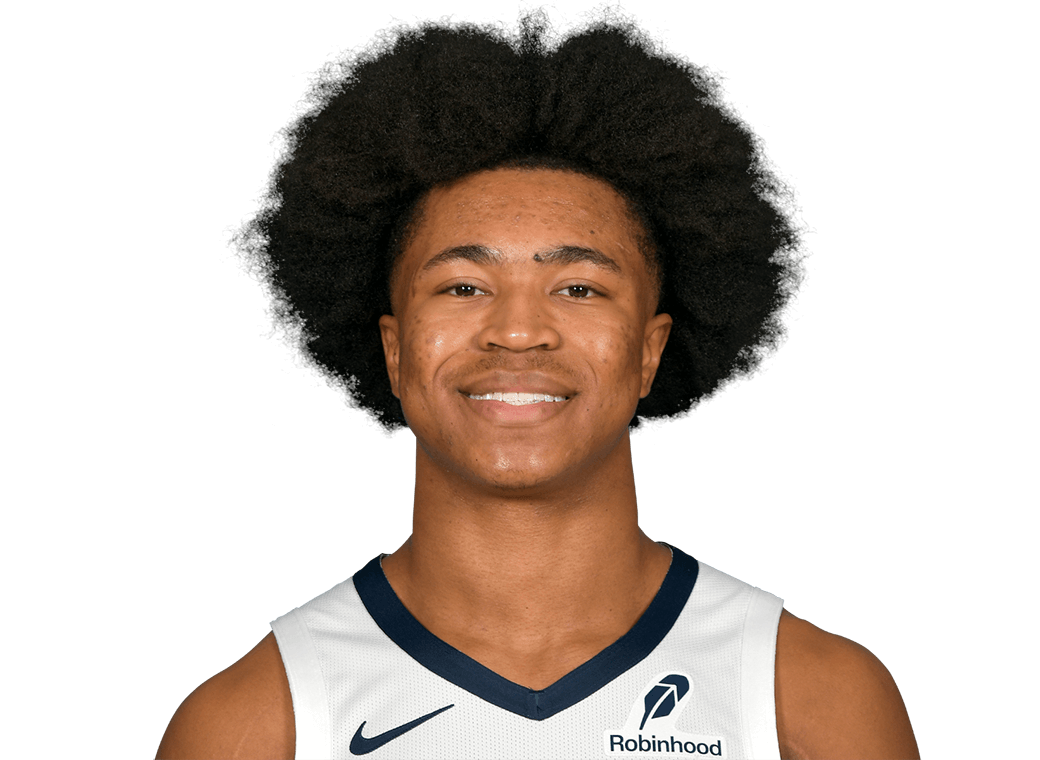 Jaylen Wells | MEM | 1 | 4.0 | 12 | 5 | 0 |
| 6 |  Bilal Coulibaly | WAS | 1 | 4.0 | 11 | 2 | 1 |
| 7 | 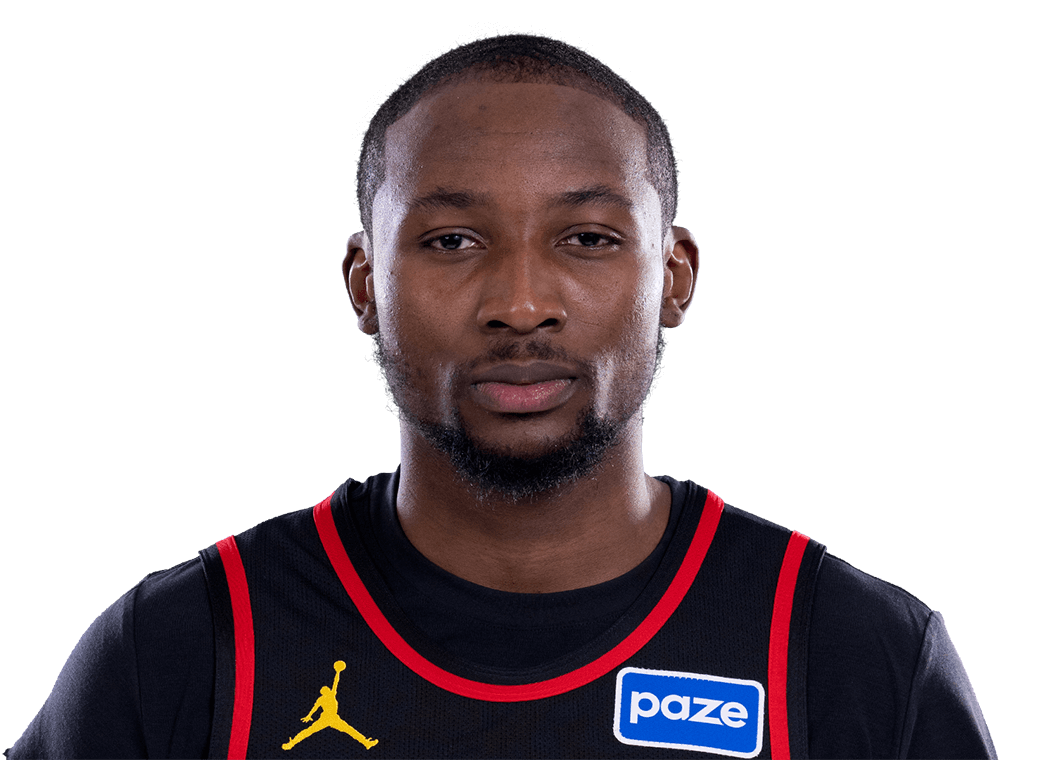 Jonathan Kuminga | MIN | 1 | 4.0 | 12 | 1 | 3 |
| 8 |  Collin Gillespie | PHX | 1 | 4.0 | 0 | 1 | 2 |
| 9 |  Kawhi Leonard | TOR | 1 | 4.0 | 23 | 6 | 2 |
| 10 |  Brandon Williams | GSW | 1 | 3.0 | 14 | 4 | 3 |
| 11 |  Shai Gilgeous-Alexander | OKC | 1 | 3.0 | 32 | 6 | 4 |
| 12 | 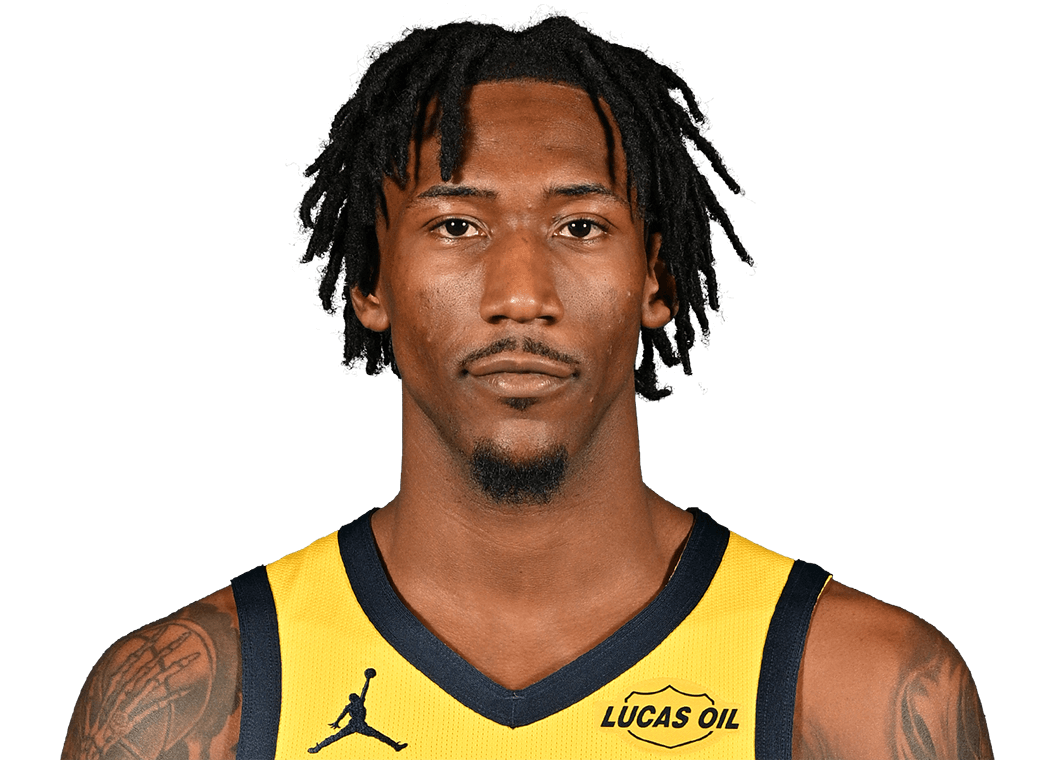 Quenton Jackson | IND | 1 | 3.0 | 6 | 4 | 1 |
| 13 | 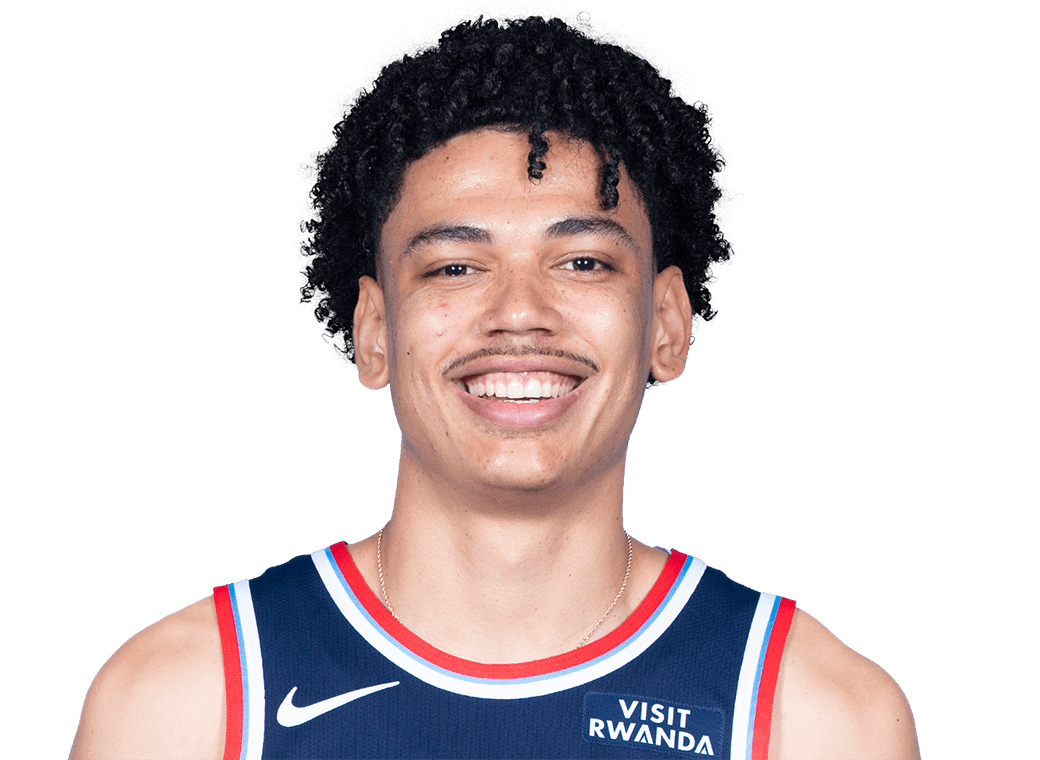 Kobe Sanders | LAC | 1 | 3.0 | 2 | 0 | 3 |
| 14 |  Cooper Flagg | DAL | 1 | 3.0 | 32 | 5 | 2 |
| 15 |  Bam Adebayo | MIA | 1 | 3.0 | 15 | 7 | 4 |
| 16 |  Caleb Wilson | CHI | 1 | 3.0 | 16 | 4 | 0 |
| 17 |  Desmond Bane | ORL | 1 | 3.0 | 18 | 5 | 2 |
| 18 |  Kris Dunn | LAC | 1 | 3.0 | 7 | 5 | 7 |
| 19 |  Jaden McDaniels | MIN | 1 | 3.0 | 17 | 8 | 1 |
| 20 | 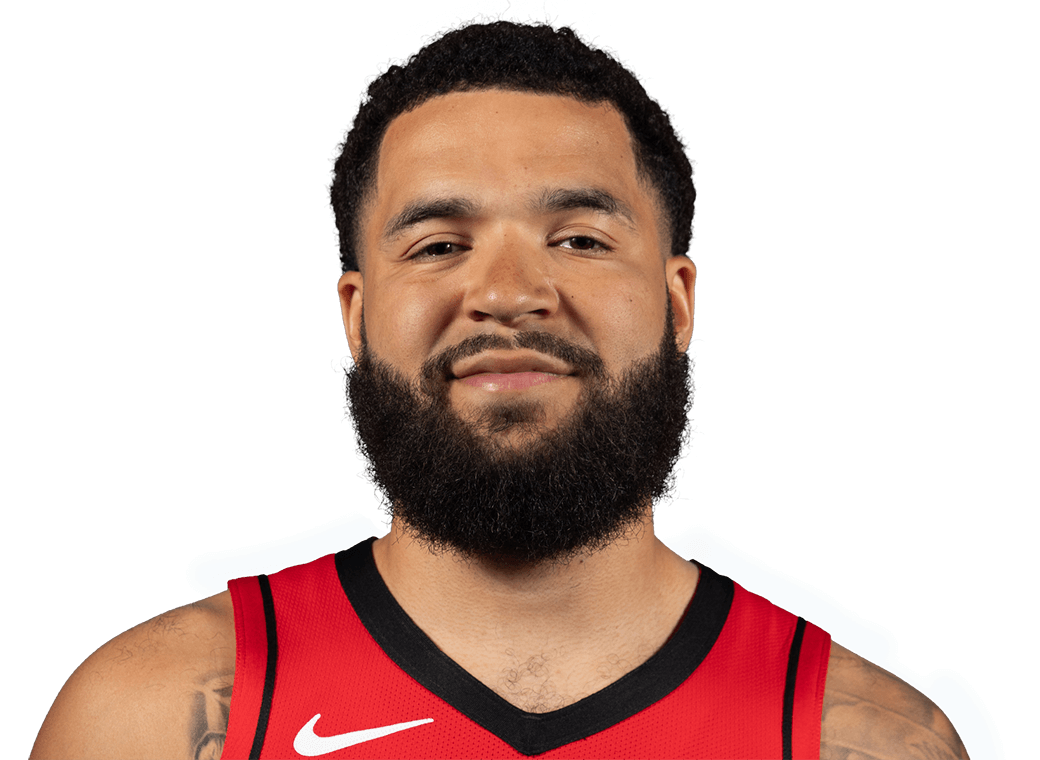 Fred VanVleet | HOU | 1 | 3.0 | 6 | 2 | 11 |
| 21 |  Ja'Kobe Walter | TOR | 1 | 3.0 | 10 | 3 | 4 |
| 22 |  Tyrese Maxey | PHI | 1 | 3.0 | 28 | 4 | 5 |
| 23 | 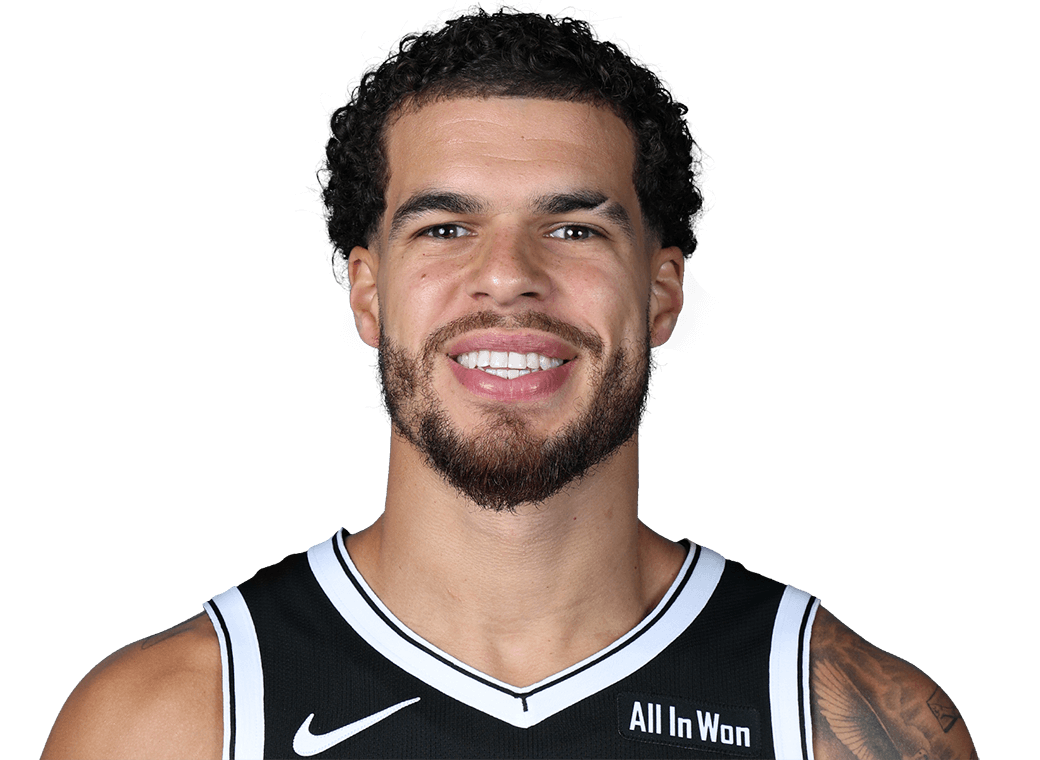 Michael Porter Jr. | BKN | 1 | 3.0 | 26 | 7 | 1 |
| 24 |  Darius Acuff Jr. | SAC | 1 | 3.0 | 12 | 3 | 3 |
| 25 |  Svi Mykhailiuk | UTA | 1 | 3.0 | 10 | 1 | 2 |
Players need to have played in at least 55% of the games of the busiest player to qualify.
Regular season and playoff games from official box scores. Season-long numbers are regular season unless you ask for the playoffs.